|
|
|
This analysis will give you an overview of the categorized climbs in the Tour de France. It is based on the most recent data from the Tour de France stages of 2009 and is thus an updated version of the analysis from last year. When assessing a climb, there is a lot of different numbers involved. So it makes things a little more simple if the climbs are put into categories based on difficulty. That's what the organizers of many of the big bike races have done, and that not only helps the riders and their teams, but also the media which often mention the categories of the climbs in order to make the coverage of the races interesting and comprehensible for their audience. The basics There are five categories: Category 4, 3, 2, 1, and then "Hors Catégorie" (beyond category) which basically just means that this category is even tougher than category 1. However, it would not be entirely correct to say that the climbs get longer and steeper for each category. As we shall see, the actual data from the Tour reveal different tendencies, and a few findings actually seem to contradict the "rules". There are many wrong conceptions about the mountains of the Tour - find out if the myths are true here!
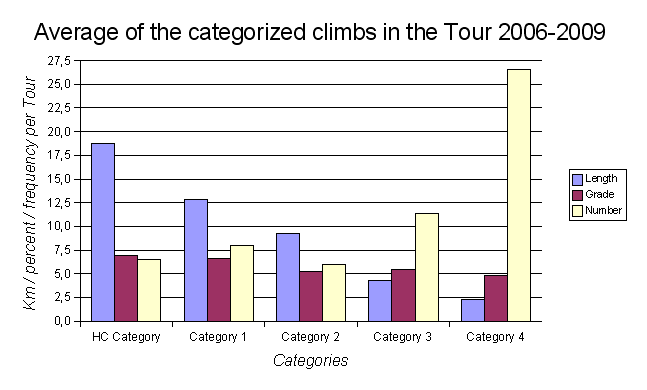
But let's now take a look at the average values of the different climb categories (minimum and maximum values in brackets): Category 4: Length: 2.3 km (min: 0.7 km*; max: 7.2 km*) Grade: 4.8 % (min: 2.7 %*; max: 7.4 %*) Category 3: Length: 4.2 km (min: 0.8 km*; max: 11.0 km) Grade: 5.4 % (min: 2.9 %; max: 11.1 %*) Category 2: Length: 9.2 km (min: 4.7 km; max: 12.9 km) Grade: 5.2 % (min: 3.7 %; max: 7.1 %) Category 1: Length: 12.8 km (min: 7.0 km; max: 23.2 km*) Grade: 6.6 % (min: 5.0 %; max: 8.1 %) Hors Catégorie: Length: 18.8 km (min: 10.6 km*; max: 42.8 km) Grade: 7.0 % (min: 4.5 %; max: 8.5 %) *) New min/max value in 2009. Length matters There are some overall observations that will not surprise us. For instance, let's compare the easiest category, Category 4, to the toughest, Hors Catégorie.
So the length is definitely a parameter that separates the categories, and as you can see, the average, minimum and maximum lengths of the climbs grow as you move up through the categories. A paradox As to the steepness, things are a bit more complicated. Firstly, the difference in grade average is not as big as you might have expected. In Hors Catégorie, the road ascends by 7.0 % in average which is 2.2 % more than in Category 4. Yes, it's steeper, but not that much steeper. And looking at the categories in between, you'll find a paradox: an average Category 3 climb is, in fact, a little steeper than an average climb in (the supposedly tougher) Category 2! That could be a coincidence, you might say, but actually, the Category 3 climbs have been steeper than the Category 2 climbs in both 2007, 2008, and 2009. And the maximum average values show even bigger differences. One climb in 2009 (which we'll get back to) had a grade of 11.1 % in average - that's the highest of all Category 3 climbs in the analyzed period. Meanwhile, the maximum average grade of the Category 2 climbs is still only 7.1 %. Why is this? Hard to know, but Category 2 is the most rare category of the Tour (only six occurrences in average per Tour). And it may be that this category is somehow "squeezed" between the really tough, classic mountain climbs and the short, more ordinary hills. From the organizers' perspective, a possible solution to this might be to adjust the two easier categories a bit so that the most difficult Category 3 climbs become Category 2 climbs - and accordingly, some Category 4 climbs could be moved up one category. There is already plenty of Category 4 climbs each year. Actually, the Category 4 climbs appear more than four times as frequently as the Category 2 climbs.
Of course, the average values derived from the around 260 climbs are only averages and do not reveal how each single climb is categorized. There is a good deal of spreading in the data - so even if the average Category 4 climb is 2.3 kilometers long and 4.8 % steep, several climbs look quite differently. One tendency is evident: If a climb is shorter than the average of the category, the climb is normally steeper than average. In the 2009 race there was an extreme example of that: Côte de Bourmont 40 kilometers from the finish line on the 12th stage. It measures only 800 meters in length. And yet it was placed in Category 3. The reason must be its extreme grade of 11.1 %. Accordingly, the climb clearly stands out from all other climbs in that category since 2006: none are shorter, and none are steeper. That said, some categorized climbs are plainly easy - with both length and steepness being in the low end. For instance, in the 2008 edition of the race, there was a Category 4 climb with an average grade of 4.6 % through 1.1 km. That's hardly a hill that would have scared the riders.
So... To summarize: In terms of steepness, the categories of the Tour de France are not all consistent. The average grade is higher in the toughest categories, but not significantly. In some cases the climbs in the easy categories are steeper. Category 2 is the least consistent category which may have something to do with the fact that the Category 2 climbs are relatively rare. Still, when it comes to length, there is significant difference between the categories. So basically, it's the length of the climbs that primarily defines a category, whereas the steepness is secondary. Feel free to comment this analysis. If you use the data publicly, please quote Danskebjerge.dk.
|


