|
|
|
ANALYSIS UPDATED: THE TOUR CLIMBS OF 2015 - LOOKING FOR NEW TRENDS
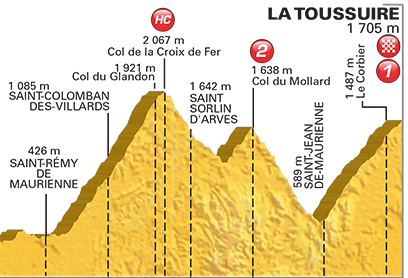
The website Danskebjerge.dk has once again examined the different values of the biggest climbs of the Tour de France. The analysis is based on the data provided by the organizers prior to the race. Thus, eventual route changes will not influence the results. The focus is on 1) the difference between this year's categorized climbs and those of the previous year, and 2) the difference between the climbs of two 4-year-intervals since 2006. A few prerequisites The reader should possess elementary knowledge of how the difficulty of a climb is usually described. Chances are you wouldn't have made it this far if you didn't! (And yes, it is going to be a bit nerdy.) Anyway, let's turn to the results. In earlier articles, the data have been shown in diagrams. That's not the case this year, but those articles are still accessible (follow the links), and most conclusions there remain valid. First, here are the values of the 2015-climbs:
· The HC climbs are 18% longer in 2015 than in the previous Tour · The Category 1 climbs are 22% longer · The number of Category 1 and 3 climbs is halved · There are now more Category 2 climbs than Category 3 climbs The increased length in the two most difficult categories is actually a little atypical of the tendency in recent years. See further below. Looking at the values across the categories, the length values look pretty regular. HC climbs (climbs "beyond category") are the longest - 17.7 kilometers -, and from there, the length is decreasing, down to the Category 4 climbs which are only 1.9 kilometers long in average. Steepness not decisive In contrast, the gradient is less predictable. For example, the climbs from Category 3 are steeper than the ones from Category 1. But as mentioned in earlier articles on this subject, it would be wrong to associate a given degree of steepness with a certain category. It is first and foremost the length that makes the big difference in terms of the categorization of climbs. In a nutshell, HC climbs are above all long, while Category 4 climbs are above all short. Such tendencies only show when we examine several Tours. So let's take a look at the Tour climbs in a broader and more "historic" perspective. The study involves 485 climbs from eight editions of the Tour de France:
Most significant differences: · The HC climbs and Category 1 climbs are 10% shorter in 2012-2015 than in 2006-2009 · The length of the Category 2 climbs has gone down by 33% · The slope of the Category 2 climbs has increased by 27% · The number of Category 2 climbs has increased by 72% · The number of Category 4 climbs has decreased by 23% As seen, it is Category 2 that has changed the most during the last nine years. Today, Category 2 climbs are considerably shorter and steeper. At the same time, there are more of them in the Tour. In earlier analyses, I pointed to exactly the problem of Category 2: This category of climbs was strangely rare and irregular. For instance, in 2006-2009 the Category 2 climbs had a lower average gradient than the Category 3 climbs, and they were less frequent than the Category 1 climbs and even the HC climbs. I don't know if the organizers read that and acted accordingly (that would be nice), or if they had come to the same conclusion themselves. But evidently, these climbs now represent a more consistent category, making the whole categorization system appear more plausible. More explosive climbs But is all this just a matter of digits and numbers? No, there is one general development that has a direct influence on the conditions for the riders.
If you look at the average of all climbs, the tendency is clear: The climbs have become shorter, but steeper. In 2006-2009, the categorized climbs had an average length of 9.4 kilometers, and a slope of 5.8%. In 2012-2015, the length was 8.1 and the slope 6.6%. The change is not dramatic. But it does seem to indicate that the modern Tour favors the more aggressive climbers rather than the durable. And that the organizers prefer a more "explosive" race. However, note how the length of both HC and Category 1 climbs have gone up in 2015 - in contrast to the development just described. A new general tendency? That is way too early to say. After all, chosing one climb instead of the other can significantly influence the average values of each year. For instance, in the upcoming Tour, stage 19 has a brutal 22.4 kilometer HC climb. I don't think there is a deeper meaning to it - the HC climb is there because it makes sense for that particular stage. More: Climbs changing: Steeper and shorter About Danskebjerge.dk 10 tough Danish climbs | |||||||||||||||||||||||||||||||||||||||||||||||||||||||||||||||||