|
|
|
NEW ANALYSIS: UNDERSTANDING THE NATURE OF CATEGORIZED CLIMBS In a stage race such as the Tour de France, the climbs always play a central role. Together with the time trials, the climbs tend to be the main factor in creating decisive time gaps. That means that if you want to understand the Tour, you need to understand the climbs, too. Based on data from several Tours, this analysis will provide you with an in-depth description of the difficulty of the climbs, and how they are categorized.
However, climbs come in many shapes and sizes, and if you take a closer look at the different climbs and the average values of the categorized climbs, you will find a considerable variation and, in a few cases, values that seem to contradict the idea of the five-category system. Hundreds of climbs examined The analysis is purely statistic, meaning that I haven't studied the exact course, the maximum steepness of the climbs, the thoughts behind the design of the routes etc. I have "only" gathered information from the route desciptions made by the organizers of the Tour, in order to show how the climb categories are defined by the race itself, in terms of the three parameters frequency, length, and steepness. In all, 186 climbs from 2012 to 2014 have been registered and put into spreadsheets. That is in addition to those 241 climbs used for the analysis of the Tour 2006-2009 which I published in 2010. But now, let's look at some of the new results. (If you're busy, you can go directly to the bottom of this page in order to see a diagram showing some of the results.)
This year's race has 63 categorized climbs. 6 of those are HC climbs, and in average, they measure 15 kilometers in length and 7.4 percent in average steepness. There are more category 1 climbs - 11 in total -, but they are shorter: 11.5 kilometers. In accordance the slope is lower - however, the difference is very small. With 7.2 percent the category 1 climbs are almost just as steep as the HC climbs. The tendency continues. When we go from category 1 to category 2 and so on, the average length of the climbs is noticeably reduced for each step, while the average slope almost stands its ground. Thus, the average slope of a category 4 climb is 6.1 percent, only 1.3 less than that of the HC category climbs. Unstable frequency Regarding the number of categorized climbs, the 2014 Tour is a little messy. One would expect the frequency to increase gradually, but it doesn't. There are less category 2 climbs than category 1 climbs, and there are less category 4 climbs than category 3 climbs. This could be seen as a simple consequence of how the route has been designed this particular year. But as the calculations show, some general irregularities appear throughout the system, as demonstrated by this diagram of the overall averages of the Tour climbs 2012-2014: 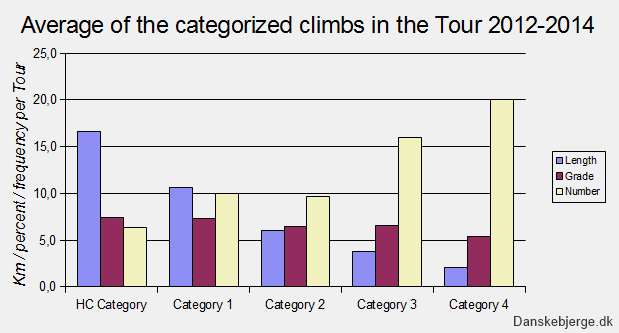
As shown, the length is reduced from category to category, more or less in accordance with the 2014 version of the Tour. For each step down, the average length of the climbs is almost halved. Irregularities of moderate climbs This regularity is less clear when it comes to occurances and slopes. The number of climbs representing each category does increase from HC category to category 4, but it looks more random. In fact, the upward movement of the curve stops at the category 2 climbs - there are a little less category 2's in the Tour than category 1's. We find a similar phenomen when looking at slope averages. Overall, there is a slight gradual reduction of the percentages when we start at the HC category climbs and continue to the other categories. But once again, the category 2 represents an exception. The average here drops to 6.5 percent which means that the category 2's are a little less steep than the category 3's (6.6 percent).
The category 2 problem Interestingly, this issue concerning category 2 is not new. The analysis of the Tour 2006-2009 showed the same things: The category 2 climbs stood out in terms of the number of climbs and in terms of steepness. So this tendency is general. Since this small study only deals with statistics, I don't know the reason for it. But perhaps the category 2 is sort of caught in the middle. A category 2 climb is not a big mountain nor is it a short hill - it is something in between. And so, the concept of that category is a bit vague, which in turn makes the organizers neglect it. Perhaps. Changing the category structure? If the system of categories were to be evaluated at some point, I would suggest taking a look at this category 2 problem. One way to solve it would be to make the categorization more objective and define the categories more precisely. This might require a statistics course among the organizers - not sure that's going to happen... Alternative: Downscale the system to four categories instead of five. It would eliminate some of the irregularities, while maintaining enough detail. Strange names Now that we're at it, you might want to consider changing the names of the category. There may be a dramatizing effect in calling a climb "beyond category" or "beyond categorization", but it's rather complicated terms, and few people know the origin of this concept (originally it was a description of mountain passes not suited for cars). The abbreviation HC is a bit strange, too. Instead, a system of four categories - called 1, 2, 3 and 4 - would be easier to handle, both in words and digits. But then again, stage races as the Tour de France are closely connected to myth and tradition, and so objectivity and clarity are not necessarily something to aim for. 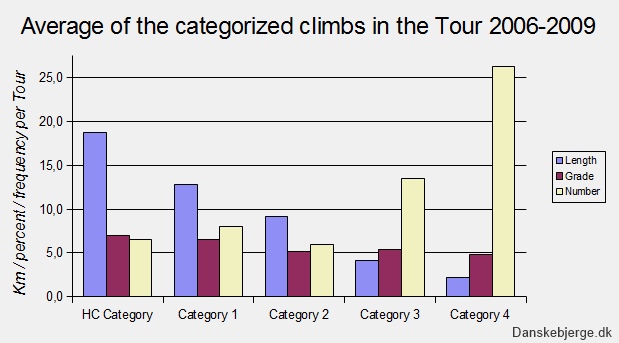
More conclusions To round off this analysis, here is a list of various other results derived from the calculations: · The Tours of 2012, 2013 and 2014 have 62 categorized climbs in average, that's three categorized climbs per stage · In every Tour 2012-2014, there are three stages completely without categorized climbs · For every HC climb, there are three category 4 climbs · The steepest categorized climb in 2012-2014 is a short category 4 climb (Jenkin Road) on the second stage of the Tour 2014: 10.8 percent in average. · In that same 2014 Tour, we find the least steep climb too: A category 4 climb on stage 12 measures a moderate 2.9 percent. · And indeed, the longest Tour climb 2012-2014 also appears in this year's version of the race. On stage 14, a category 1 climb (the Col du Lautaret ) has a lenght of no less than 34 kilometers. The slope is 3.9 percent. · Three climbs share first place in the fight for being shortest. They are each 0.7 kilometers long. · A comparison between the years 2012-2014 and 2006-2009 shows that the average steepness has gone up in all five categories. In 2012-2014, an average climb has a slope of 6.6 percent. In 2006-2009, the slope was 5.8. · Meanwhile, the average length has gone down: From 9.4 kilometers in 2006-2009 to 7.8 kilometers in 2012-2014. (See this story.) 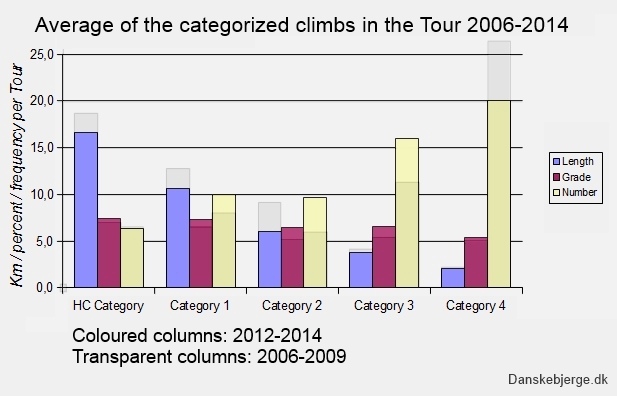
Note: Please do not use the above data without crediting Danskebjerge.dk and/or linking to this page. Related articles: Updated analysis: 2015-edition Earlier analysis Tough Danish climbs About the site | ||||||